Candlestick patterns are one of the most important tools a trader needs in the Forex market. These patterns could be single, two ones or triple. In our article today, we will talk about the triple candlestick patterns that are the most important Japanese candlestick patterns. This strong triple pattern indicates where it appears on the chart, an imminent price reversal is possible, and it may be an upward or a bearish reversal. Now let's start with the bullish (positive) pattern.
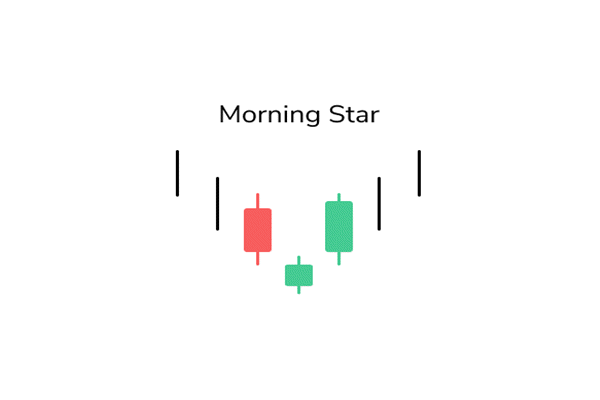
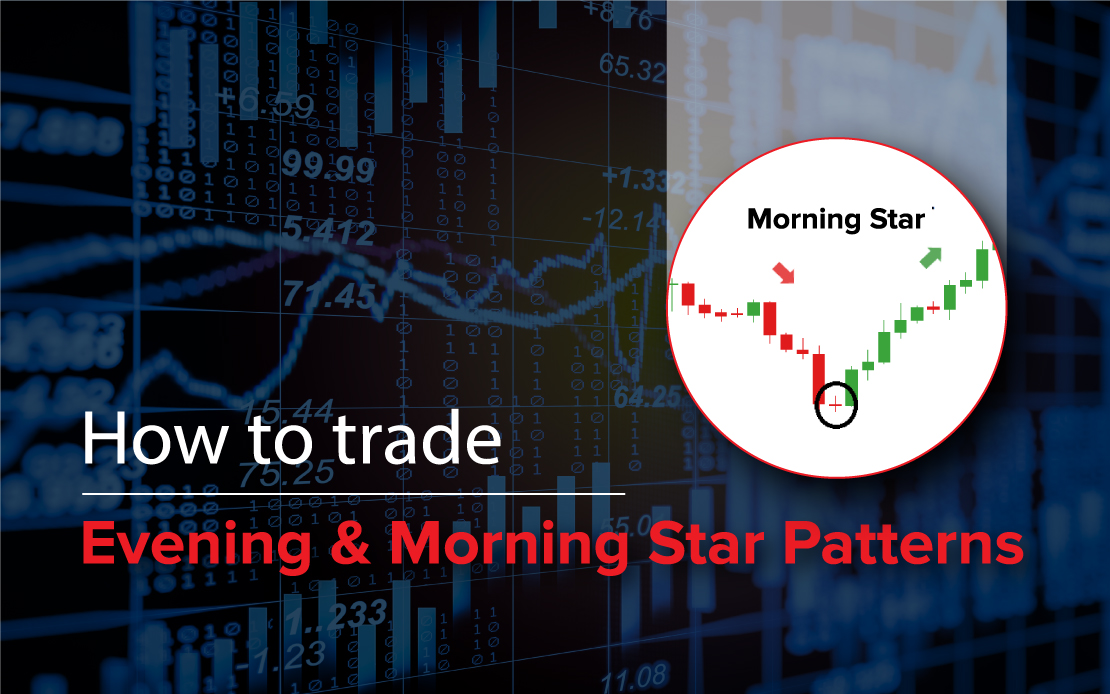
The morning star pattern, as shown on the graph, includes a long red candle at the end of a downward trend followed by a small body candle. The closing price is lower than the price of the previous candle closing (sometimes, but it is sufficient for the candle to be small only), then a third strong green candle followed by a large size; Its closing is higher than the middle price point of the first red candle.
What happened? There was a very strong downtrend which could be seen through the long red candle, and although it was expected that the downtrend would continue, there was a surprise in the following session in the small red candle that indicates that the bears and bulls were approximately equal in strength in both directions. Now all of a sudden in the third long green candle, bulls wins the battle.
First candle: A long red candle formed during a downtrend, and that candle indicates a strong bearish feeling
The second candle: a red or green candle that is very small in size and has long shadows. This candle represents the sudden stop of the downtrend
The third candle: a green candle the length of which is greater than half the length of the first red candle, and that candle represents the reflection of the market sentiment and the direction of prices towards the rise
The middle candle with a small body is somewhat similar to the shape of a star. That star appeared at the end of a downtrend (which indicates the night) and before the first green candle appeared and it is the first candle in the upward direction due to the reflection (which indicates the day), and please note that the white and black color were previously used in the charts and were The bearish candle is colored black while the bullish candles had the white color.
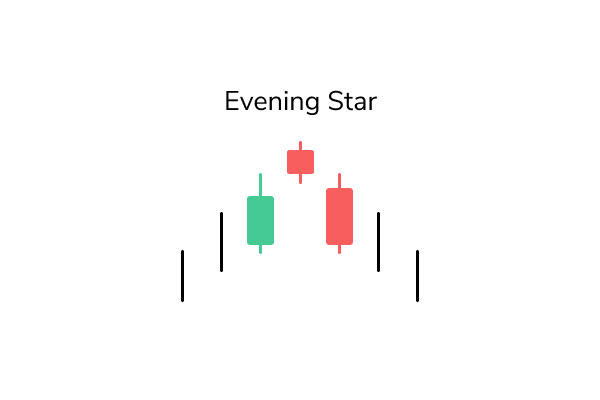
In contrast to the morning star pattern, the evening star pattern includes, as shown in the chart above, a long green candle and a small body candle in the middle, followed by a third long red candle that completes the pattern and the closing price in the last red candle is below the middle of the first green candle.
Psychological analysis of the market in this pattern is very interesting. To see: We were in the middle of an upward trend in which the bulls clung and had the upper hand in it, the involvement in buying appeared on the first green candle and in the next session the price rose to the highest, but it was clear that the bears resisted it and landed it before closing the session to a level close to the opening level, and the opportunity was open For the bears in the third session to reverse the upside and move downward after the bulls are tired, which led to the emergence of the third red candle.
First candle: A long green candle formed during an uptrend. This candle indicates a strong bullish feeling
The second candle: a red or green candle that is very small in size and has long shadows. This candle represents a sudden, inconclusive refraction of the bullish trend
The third candle: a red candle the length of which is greater than half the length of the first green candle. This candle represents a reflection of the market sentiment and the direction of prices towards the downside.
Why is this pattern called "Evening Star"?
The middle candle with a small body is somewhat similar to the shape of a star that appeared at the end of an uptrend (which indicates the night) and before the start of the downtrend (which indicates the day), and this is why it is called the evening star, and as we indicated previously, it was white and black that were Previously used in charts, the red candle was colored black, while the green candle was colored white, so the star that appears at the end of the model and white color symbolizes "the day".
Get financial advice from Point Trader Group experts.
For free expert financial advice.