
Chapter 4 - Introduction to technical indicators
Lesson 4.3 - Commodity Channel Index (CCI)

The Commodity Channel Index (CCI) is one of the leading momentum oscillators, developed by Donald Lambert to identify periodic turns in commodities but it can also be used in securities, the foreign exchange market "Forex" and bonds as well. The Commodity Channel Index (CCI) is a comparison of the typical price (TP) and the simple moving average (SMA) of the typical price (SMATP), and it is expressed as a volatile percentage that can exceed -100% and 100%. It can be used to predict price reversal and determine sale climax or oversold conditions.
How is the Commodity Channel Index (CCI) added to the chart in the MetaTrader 4 platform?
إIf the interface of the platform is in English, you need to follow these steps:
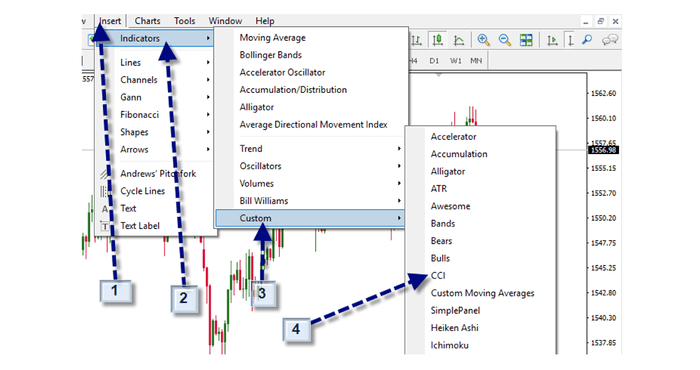
1- Click on the “insert” tab .
2- Click on the indicators
3- Click on the word “custom”.
4- Click on the word “CCI”
After clicking on the word “CCI” and choosing the desired indicator, the following interface will appear to us:
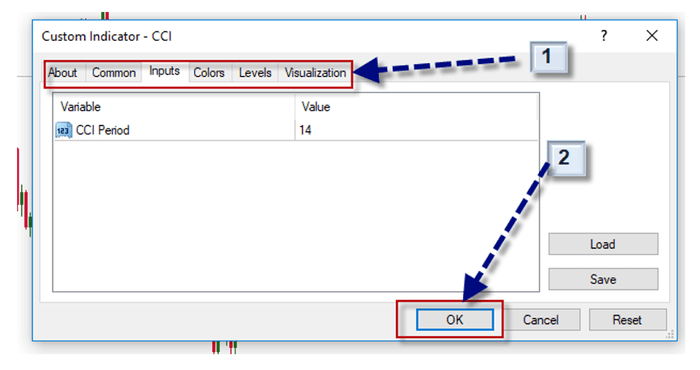
1- The indicator settings are adjusted according to the technical analyst desire, or the default settings are kept.
2- Click “Ok” after choosing the required settings.
The following chart shows the general appearance of the Commodity Channel Index (CCI) with default settings, as it appears on the MetaTrader platform
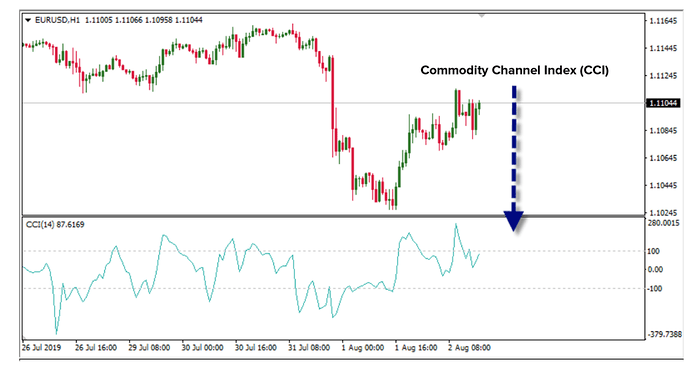
The previous chart shows the Commodity Channel Index (CCI) in the lower chart board on the 60-minute chart for EUR\ USD. The blue line is the Commodity Channel Index (CCI).
How are the CCI measurements calculated?

Since Commodity Channel Index (CCI) is based on the assumption that commodities, securities, "Forex" and foreign exchange markets move in cycles, with high and low levels reached at periodic intervals, it is recommended that you use a third (⅓) of a full cycle from low to low or high to high CCI timeframe.
Thus, if it takes 60 periods to complete, it will be recommended to use CCI for 20 periods. Once you define the CCI timeframe, you can calculate the CCI in four steps:
- First, calculate the typical price for the last period (TP) which is (H + L + C) / 3 where H = high, L = low, and C = close.
- Second, compute the Simple Moving Average of the TP (SMATP) for the CCI period (i.e. 20 periods for the CCI for 20 periods)).
- Third, calculate "average deviation", which is the sum of the difference between the recent period SMATP and the usual price for each CCI period divided by the number of periods.
- Finally, calculate the CCI using the following formula: CCI = ( TP - SMATP ) / ( 0.015 x Mean Deviation)
How is the CCI used?
Use Lambert CCI to generate entry and exit signals when the CCI moves above + 100% and less than 100%, respectively. When the CCI moves above + 100%, the price enters a strong bullish trend and an entry signal is given. When the CCI moves below + 100%, all current contracts should be closed.
Conversely, when the CCI moves below -100%, the price enters a strong bearish trend and an exit signal is given. When the CCI moves again above -100%, all traded contracts should be closed.
Additionally, an entry signal is given when the CCI bounces off the zero line. When the CCI reaches the zero line, the average price of the security is in the moving average used in the CCI calculation, and when the price bounces back from the moving average, the entry position is considered good as the price retracted to its short-term support with a rebound to confirm the current trend.
CCI can also be used to determine oversold levels and overbought levels. The price can be considered oversold when the CCI moves below -100 and it can be considered overbought when it moves above +100. From the oversold level, an entry signal can be given when the CCI moves above -100. From the overbought level, an exit signal may be given when the CCI moves below 100 +.
Divergences Application
Divergences can also be applied to CCI. A positive divergence less than -100 would increase the likelihood of a signal based on a move above -100, and a negative deviation above +100 would increase the likelihood of a signal based on a move below +100.
Trend line separators can be used to generate entry and exit signals. Trend lines connecting peak and troughs can be drawn. From oversold levels, a move above -100 andthe trend line break can be used as an entry signal. On the contrary, from overbought levels, a move below +100 and and the trend line break can be used as an exit signal.