Chapter 3 - Introduction to charts
Lesson 3.4 - Peaks & Troughs

The Concept of Price Trend
The price trend very simply is the market trend and the way in which it moves, but we need a more precise definition. First of all, we have to say that the markets do not generally move in a straight line in any direction, and the market movements are characterized by a series of winding lines.
The concept of price trend is a basic concept for applying the technical analysis method to market analysis. All tools used by the technical analyst are tools that help to measure the market trend for the purpose of speculation in this trend.
The following tools (peaks and troughs, support and resistance, trend lines, price channels) are the classic tools used for identifying the market trend.
Peaks & Troughs
Markets do not move in straight lines, and financial market movements are characterized by a series of winding lines. These winding lines are represented in a series of ripples of very clear peaks and troughs, and the market trend consists of these peaks and troughs.
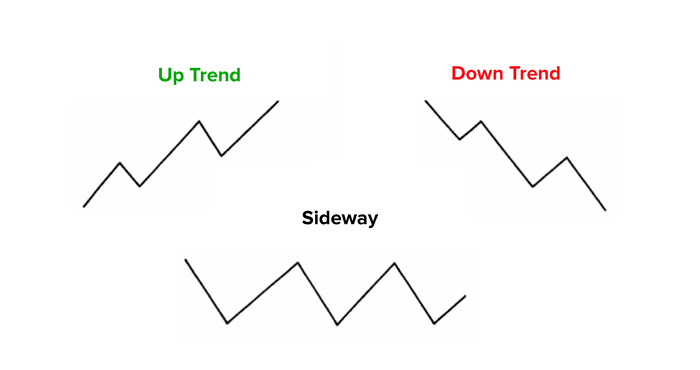
An uptrend (bullish trend) can be defined as: a series of ascending peaks and troughs.
A downtrend (bearish trend): is a series of descending peaks and troughs.
A side way: is a series of horizontal peaks and troughs.
The following figure shows the three market trends in an abstract way, clearly summing the peaks and troughs.
With more scrutiny, you will find that the trough is an area where buyers outperform sellers, and they are able to push prices up, i.e. the trough is the beginning of buyers outperformance.
The peak is a region where sellers outperform buyers, and it is a region where sellers are able to impose their control on purchasing power, meaning that the peak is the beginning of the sellers outperformance.
Peaks and troughs are a basic concepts in understanding the market trend, and understanding this well gives the analyst a deeper understanding of the classic tools that will be explained later. Here, we are not offering an explanation of the psychological aspect underlying the peaks or troughs, but we rather provide a simple explanation of the mechanism in which peaks and troughs work.
We have previously agreed that the trend is a series of peaks and troughs, which means that the peaks and troughs clarify the relationship between sellers and buyers.
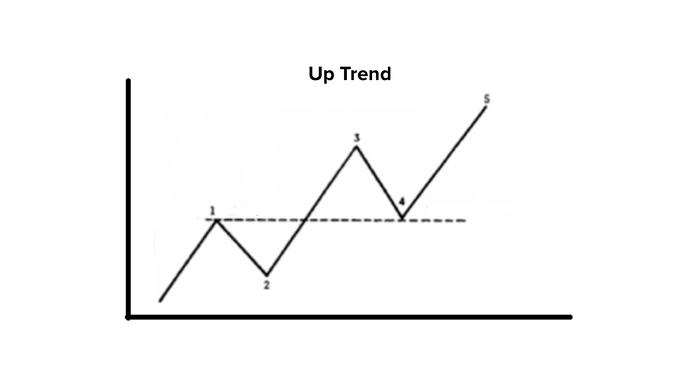
The beginning of the uptrend (Bullish Trend)
Here, we will explain how the uptrend begins, that is, how buyers begin to impose their control on the market creating a new bullish trend.
The classic beginning of an uptrend takes place when prices start forming a peak (peak 1) then a trough (trough 2), then the prices break the first peak up, consequently making a next higher peak (peak 3), then a trough (trough 4) higher than the previous trough.
The following figure shows the beginning of the uptrend.
Bullish peaks mean that buyers have enough reasons to keep pushing prices up and achieving new higher prices, while bullish troughs mean that sellers are not able to continue selling, which means superior purchasing forces.
This sequence of peaks and troughs signifies the beginning of a new uptrend, whatever time frame on which this formation is noticed.
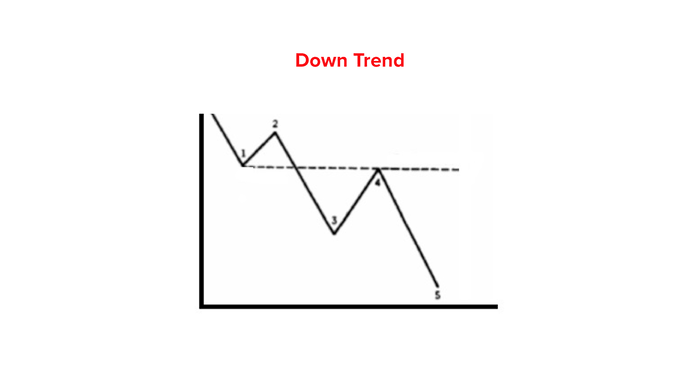
The Beginning of the Downtrend
Now, we will explain how the downtrend begins, i.e. how the sellers begin to have control over the market creating a new downtrend.
The classic beginning of the downtrend takes place when prices start forming a trough (trough 1) then a peak (peak 2). Then, the prices break the first trough down, consequently making a next lower trough (trough 3), then a peak (peak 4) lower than the previous peak.
The following figure shows the beginning of the downtrend.
Bearish troughs mean that sellers have enough reasons to keep pushing prices down and achieving new lower prices, while bearish peaks mean that buyers are not able to continue buying, which means superior sales power.
This sequence of peaks and troughs signifies the beginning of a new downtrend, whatever time frame on which this formation is noticed.