
Chapter 3 - Introduction to charts
Lesson 3.3 - Japanese Candlesticks
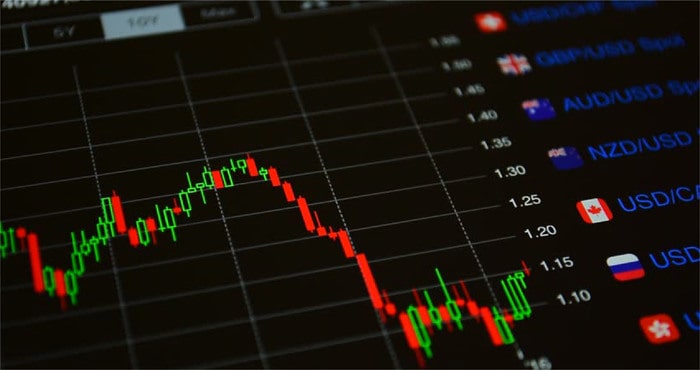
In our presentation of the most popular methods of quotes display, we talked about the so-called Japanese candlestick charts, and we pointed in passing about the importance of these candles, but here we have to clarify more for the reader that Japanese candlesticks have become the most prevalent type of charts, and the most important types of charts in the market price display.
The value of the Japanese candlestick charts is attributed to the fact that they give the graph a great vitality, and it makes the task of the graph reader easier, as with just a look, he can distinguish the bullish sessions from the bearish sessions. On the other hand, the Japanese candlestick charts have their own technical forms through the market trends can be read, or it at least gives signals about the change in the trend of the price waves.
Now, we have to explain how to read Japanese candlestick charts in more detail.
The Japanese candlestick charts are based on four basic data, which are (opening price, closing price, highest price, lowest price), and the candles shape should be like this.
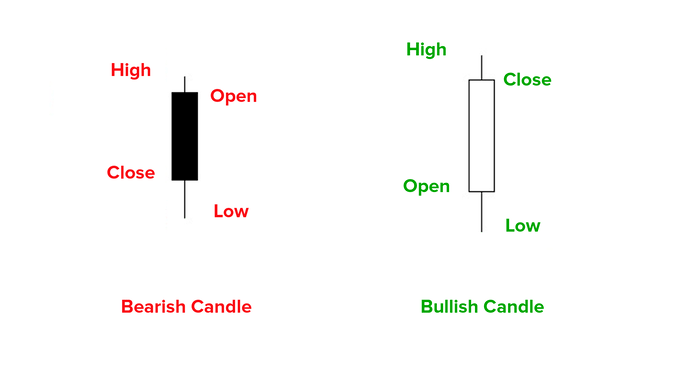
A candle is bullish when the closing price is higher than the opening price, while a bearish candle is a candle in which the closing price is lower than the opening price. The Japanese candles usually have their own colours that make you easily distinguish between bullish candles and bearish candles, in this figure, the black candle represents a bearish candle and the white candle represents a bullish candle.
The highest price and the lowest price are the tails of the candles, while the opening price and the closing price are the body of the candle. The distance between the lowest price and the highest price represents the daily trading range, while the distance between the opening price and the closing price represents the extent to which one of the two teams, either the sellers or buyers, outperforms .
In an ascending candle, when the body of the candle is large, this means that the buyers outperformed with great force and momentum over the sellers, and the same goes for a bearish candle. The large body of a bearish candle means a greater domination for sellers over buyers.
This is not all about the Japanese candlestick charts, this is just a small start ... !!
The Japanese have largely focused on the relationship between the opening and closing prices because they are the two emotionally charged points during the day. The relationship between the opening price, the highest price, the lowest price and the closing price completely change the shape of the candle, and now we direct our attention to how the candles, either individually or in patterns, provide signals about market trend.
Japanese candlestick charts need a complete book addressing them in more detail about their history, shapes, and also about strategies for their use within markets.
We don't have this much space to demonstrate everything about the Japanese candles, so we'll make it brief and focused on the basics of the Japanese candles stick so that the reader becomes familiar of the different aspects thereof.
We have quickly indicated that the Japanese candlestick charts provide signals about the market trend, either individually or in patterns, but we also want to add a small piece of information, that the Japanese candles, whether individual or in patterns, can be signals for a trend reversal or signs of continuing the trend.
Note that the word “trend” in our explanation of the Japanese candlestick charts is not intended to reflect the concept of the markets trend in its broad sense, but is merely limited to “the trend of the current price wave", which is very important to accurately understand the Japanese candles. Candles reflect the trend of a price wave, not an entire trend.
We think it is better, in order to avoid distraction, to make our focus on explaining reflex patterns, whether they are individual candles or patterns, because continuity candles need an extensive explanation and understanding so as the reader can distinguish them.
- There are basic rules that increase the top of the reflexive candles.
- Price wavelength
- The longer the price wave moves, the higher the probability that the Japanese candles validity in reversing the wave.
- Where candles appear
- If the Japanese candles appear near the support, resistance, or trend line, the candlestick effect is stronger.
- Perfect Grade Candles
- While explaining the candles and patterns, they will be explained in their perfect form, but the candles do not always appear in their perfect forms while trading in the markets.
- Candles position in relation to the general market trend
This simply means during an uptrend the candles that support the strong bulls always work well, while the negative candles do not work.
Likewise, the bearish candles that support the strong bear are always working well, while the positive candles do not work.
These are the most important rules that increase the value of Japanese candles during trading. We confirm that the candles reflect the trend of a price wave rather than the entire trend.
Individual candles
We begin here to explain the most famous and most recurrent individual reflective candles in the market.
Hammer and Hanging Man Candlestick
A hammer or hangman candle can be identified by three criteria that are:
- The body of the candle is at the top of the trading range, and the colour of the candle does not matter.
- The lower shadow is long and should be twice the height of the candle body.
- It should not have an upper shadow, or that shadow, if any, shall be too small.
The following figure shows the perfect image of this candle.
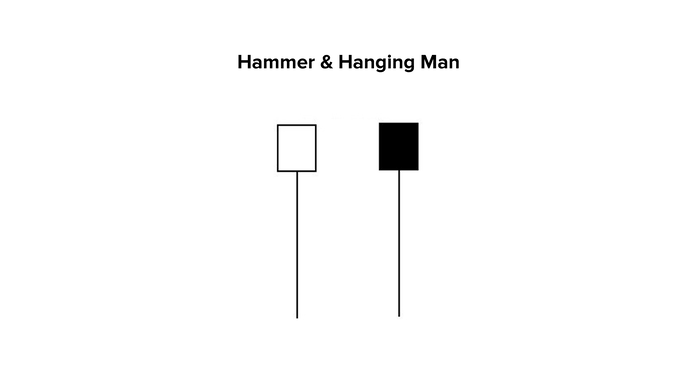
This candle is called the “Hammer” when it comes at the end of a bearish wave (i.e. it supports the ascending trend), and it reverses the wave trend from bearish to bullish,
while it is called the “Hanging Man” when it comes at the end of a bullish wave (i.e. it is a candle that supports descending trend), it reverses the wave trend from bullish to bearish.
Inverted Hammer and Shooting Star Candlestick
A hammer or hangman candle can be identified by three criteria that are:
- The body of the candle is at the bottom of the trading range, and the colour of the candle does not matter.
- The upper shadow is long and should be twice the height of the candle body.
- It should not have a lower shadow, or that shadow, if any, shall be too small.
The following figure shows the perfect image of this candle.
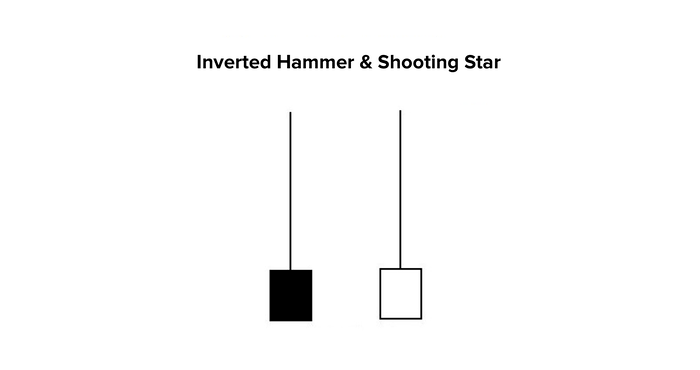
This candle is called the “Inverted Hammer” when it comes at the end of a bearish wave (i.e. it supports the ascending trend), and it reverses the wave trend from bearish to bullish,
while it is called the “Shooting Star” when it comes at the end of a bullish wave (i.e. it is a candle that supports descending trend), it reverses the wave trend from bullish to bearish.
Candlestick Patterns
Here, we begin here to explain the most famous and most recurrent reflective candles in the market.
Bullish Engulfing and Bearish Engulfing
The bullish engulfing pattern can be identified by the following criteria.
- The market should be in a clear bullish or bearish general path.
- The engulfing pattern consists of two candles, the body of the second of which must fully engulfs the first candle body (it is not a condition that it engulfs its lower and upper shadows).
- The colour of the second candle should be the opposite of the colour of the first candle.
The following figure shows the perfect image for this pattern.
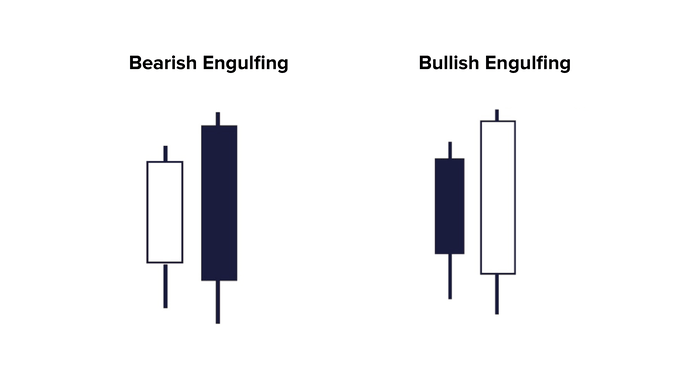
The bullish engulfing pattern comes at the end of a bearish trend to change the trend from the bearish to bullish. The first small candle means weakness in the sellers activity. Then, the next candle comes with a large buying activity that engulfs the selling activity of the previous day.
The bearish engulfing pattern comes at the end of a bullish trend to change the trend from the bullish to bearish. The first small candle means weakness in the buyers activity. Then, the next candle comes with a large selling activity that engulfs the buying activity of the previous day.
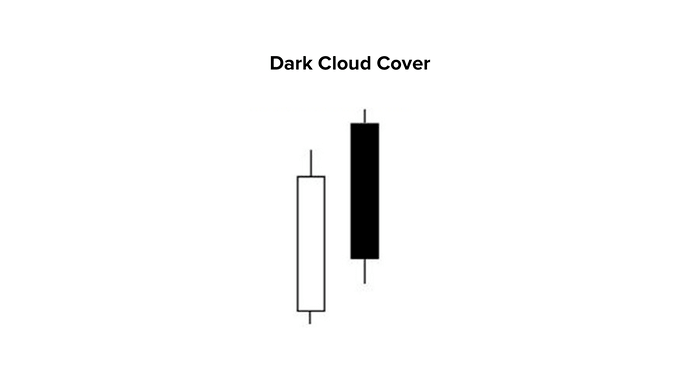
Dark Cloud Cover and Piercing Line Pattern
The dark cloud cover pattern can be identified as follows.
The pattern consists of two candles in the bullish market, the first candle is white and the second candle is long and black, the second candle opens with a strong rise that raises to the highest level of the highest price of the previous white candle, and then, prices begin to fall down to form a relatively long black candle that closes below the mid point of the previous day's white candle.
The following figure shows the perfect form for this pattern
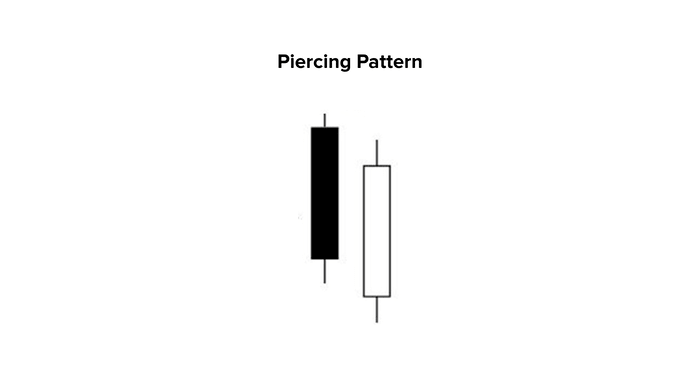
The piercing line pattern can be identified as follows.
The pattern consists of two candles in the bearish market, the first candle is black and the second candle is long and white, the second candle opens with violent drop that falls below the level of the lowest price of the previous black candle, and then, prices begin to rush up to form a relatively long white candle that closes above the mid point of the previous day's black candle.
The following figure shows the perfect form for this pattern.
We would like to remind you again that we do not have much space to demonstrate everything about the Japanese candles, and all what we have offered here is just a small start to get to know and master the Japanese candlestick charts. The ability of the Japanese candles to determine the markets trend and determine the extent of the buyers' strength or weakness is what gives them greater value and wider spread compared to any other method of money market display charts.