
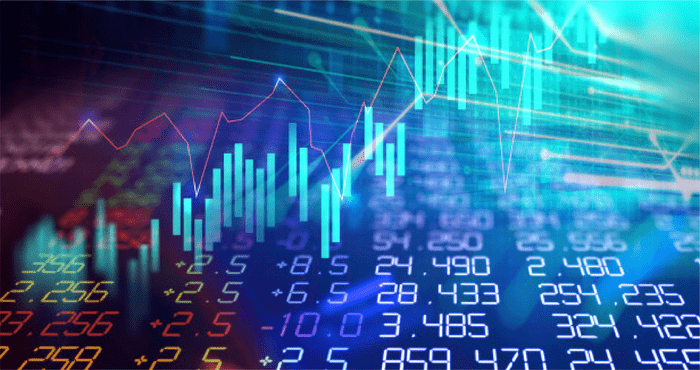
Chapter 4 - Introduction to technical indicators
Lesson 4.0 - Technical Indicators
Would you like to start the trading game? It is important to search for the best technical indicators to proceed with this procedure with high level of professionalism. This affects how the trends are interpreted, whether in case there is a clear price trend or on broad averages, "intraday performance, or the full performance of trading operations" as well as the type of opportunities that appear in your search on the trading platform. Choose wisely and build a solid basis for success in speculation, or choose a weak system, and predators will line up for their share of you one by one, and you will be willing to lose continuously.
Most beginners follow the herd when creating the first trading strategies, taking possession of a bunch of canned indicators and stuffing as many as possible under their favourite stock price bars. The phrase "more means better", which means that the more the number of tools and indicators used in technical analysis is, the better to produce short circuits because they refer to the market from many angles at the same time. It's ridiculous because the indicators work better when you simplify analysis, reduce noise and provide usable output by trend, momentum, and timing.
In fact, almost all technical indicators correspond to five categories of research. Each category can be divided into additional or late section. The main indicators predict where the price will go while the late indicators fall behind the price, or these indicators track price movement when the price is in a driving movement.
- Trend indicators analyze whether the market is moving up, down, or sideways over time.
- Average bounce indicators (lagging indicators) measure how long the price will swing before the counter rush leads to a bounce.
- The relative strength index (RSI) (leading indicators) measure volatility in the buying and selling pressure.
- Momentum indicators (leading indicators) assess the speed of price change over time.
- Volume indicators calculate trades and determine the extent to which bulls and bears dominate.
Therefore, how do beginners choose the correct setting at the beginning and avoid weeks and months of producing ineffective signals?
The best way, in most cases, is to start with the most common numbers with setting one indicator at a time and see if the output is helping or harming your performance. Using this method, you will quickly understand the specific needs of your level.
Now you understand the five ways in which indicators work to understand market movement.
Leading and Lagging Technical Indicators of Price Movement
Technical indicators are divided into two types: indicators that follow the price movement "trend indicators" and indicators that lead the price movement “volatility indicators”.
It is understood that the main "leading" indicator indicates the trend in which the price is moving, while the lagging indicators "trend indicators" indicate background conditions when the price is already in motion.
Preparing technical indicators for numerical inputs most appropriate to a particular trading pattern requires a specific set of experience and skills
What are the most important leading technical indicators?
Volatility Indicators: They are the indicators that predict the price movement, in other words, they indicate the possibility of reversing the trend in advance. Most of the leading technical indicators measure the price movement during a fixed period. We will review the most important of these indicators in the upcoming lessons.