Chapter 4 - Introduction to technical indicators
Lesson 4.1 - Relative Strength Index (RSI)

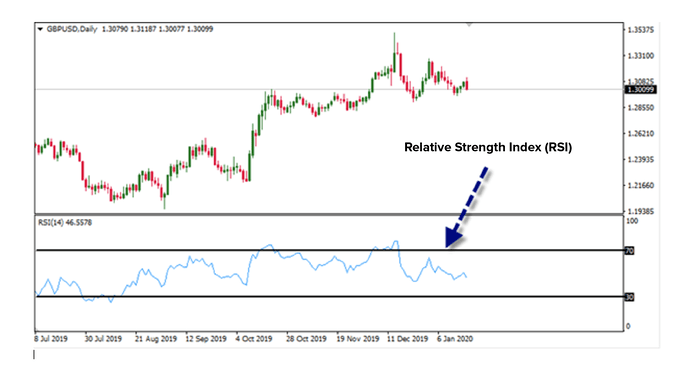
The Relative Strength Index (RSI) is a very useful volatility momentum indicator developed by J. Welles Wilder, and it is one of the most widely used indicators in technical analysis. The relative strength index (RSI) was first introduced in the 1978 in J. Welles Wilder’s book “New Concepts in Technical Trading Systems”. It compares the size of the gains made by the last security to the size of its recent losses to determine the conditions of selling climax and oversold.
To add the relative strength index (RSI) to the MetaTrader 5 platform if the interface is in English, you need to do the following:
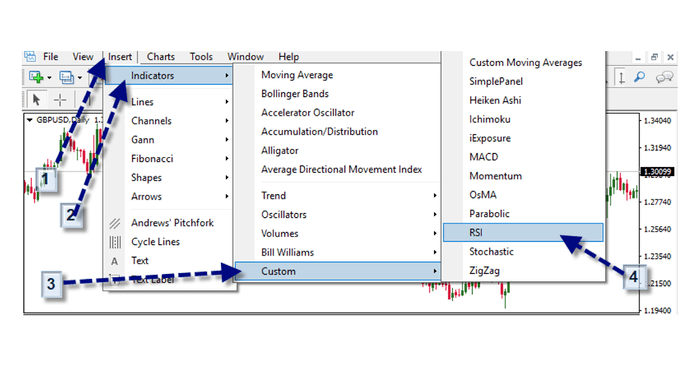
1- Click on the "insert" tab.
2- Click on the indicators.
3- Click on the word “custom”.
4- Click RSI.
After clicking on the word “RSI” and choosing the desired indicator, the following interface will appear to us:
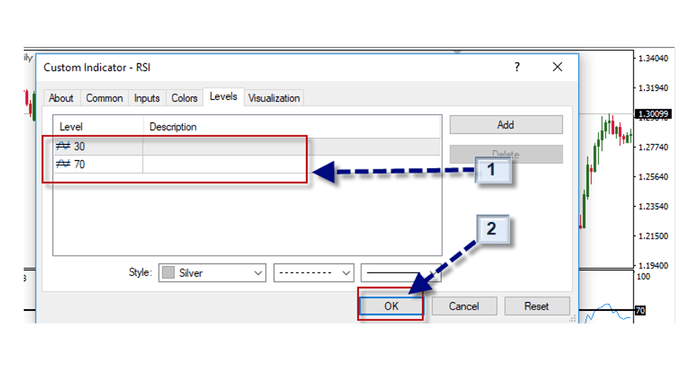
1- The relative strength (RSI) settings are adjusted according to the technical analyst desire.
2- Click “OK”, so we have the indicator on the trading platform as it appears in the following form:
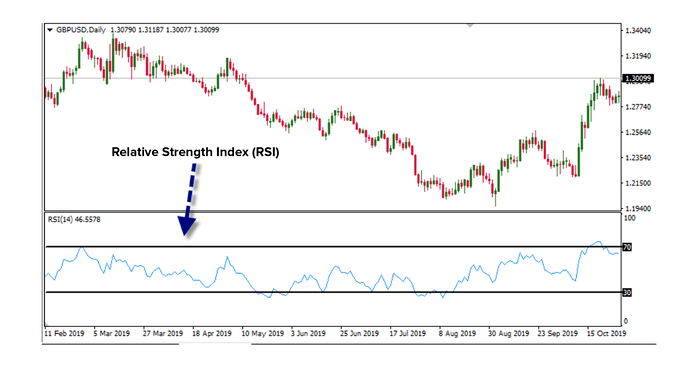
The relative strength (RSI) with the default settings is shown in the previous figure.
How are RSI measurements calculated?
The relative strength index (RSI) is calculated in two steps. First, the relative strength (RS) is determined by dividing the average gain over the course of the reversal period by the average loss during the reversal period. However, these are not real averages because they are divided by the reversal period. The following formula is used to determine the RS value:
RS = (sum of price gain + gain of the N bar \ (sum of price loss + loss of the N bar)
Where: N is the reversal period; the sum of the profit in price is calculated over n - 1 periods (one less than the reversal period) and the amount of the loss in price is also calculated over n - 1 periods.
The second step connects the RS with a range from 0 to 100 and produces the RSI. The formula for the second step is:
RSI = 100 - 100 / (1 + RS)
The default period, as proposed by Wilder, is 14 years although some traders prefer to use the RSI for 8 periods over intraday basis, while others prefer to use the RSI for 28 periods.
See the following chart for the 14-day RSI, on the foreign exchange market "Forex”.
The GBP \ USD pair.