
Chapter 4 - Introduction to technical indicators
Lesson 4.7 - Average Directional Index (ADX)

Average Directional Index (ADX) is a "price movement" lagging trend indicator designed by J Welles Wilder that indicates the strength of the trend, when the stock or security is in an uptrend or strong downtrend, or whether it is moving sideways. It is part of an index system that is called Wilder's DMI, which was first introduced in J. Wells Wilder ‘s book “New Concepts in Technical Trading Systems of 1978”. Wilmi's DMI consists of three lines that are: + DI line, -DI line, ADX line, but Average Directional Index (ADX) can also be used independently and on any trading timeframe to help you identify key turning points in the market. The Average Directional Index (ADX) is an oscillator that fluctuates between 0 and 100. Values above 40 generally indicate a strong trend, and values less than 20 indicate a weak trend or stable trading ranges.
However, the Average Directional Index (ADX) does not indicate whether the trend is bullish or bearish. It only indicates the strength of the current trend. Thus, a value above 40 could indicate a strong bullish trend as well as a strong downtrend. Very high values indicate that the trend is likely to end.
Also, the Average Directional Index (ADX) does not give entry or exit signals. However, it provides you with some assurance about the location of the stock or security in the trend. Low readings and you have a trading range or a beginning of a trend.
How is Average Directional Index (ADX) added to the graph on the MetaTrader 4 platform?
If the interface of the platform is in English, you need to follow these steps:
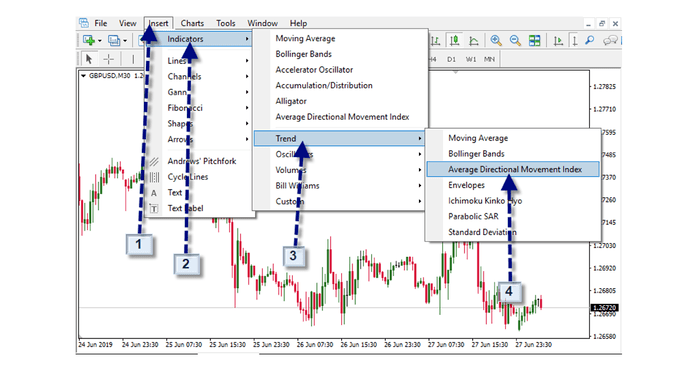
1- Click on the “insert” tab .
2- Click on the indicators
3- Click on the word "Trend"
4- Click on the word “Average Directional Index”
After clicking on the word “Average Directional Index” and choosing the desired indicator, the following interface will appear to us:
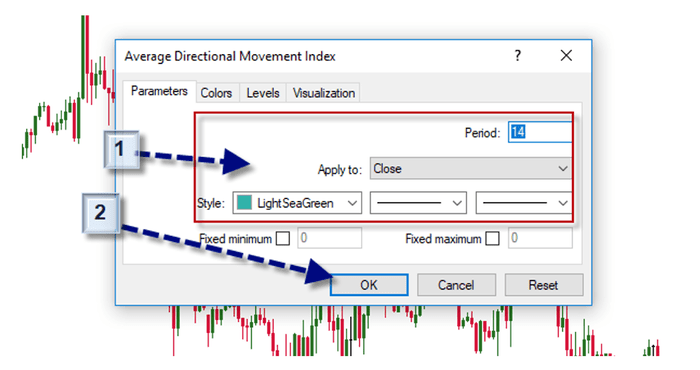
1- The indicator settings are adjusted according to the technical analyst desire, or the default settings are kept.
2- Click “Ok” after choosing the required settings.
How is the Average Directional Index (ADX) used?
In general, a strong bullish stock or security must be purchased and held until one or more momentum indicators, such as the RSI or the CCI, indicate a weak sign. The shares in the trading range, i.e. the sideways movement in a narrow range, should be analyzed using an oscillator, such as the stochastic oscillator of the entry and exit points.
When the Abu Dhabi Securities Exchange ranges between 0 and 20, this indicates that the stock is in a trading range and that you need an oscillator to determine the entry and exit points.
When the Average Directional Index (ADX) moves above 20, this indicates the beginning of the trend, although it could be an uptrend or a downtrend, so remember to check whether it is an uptrend or downtrend before committing to trading.
When Average Directional Index (ADX) moves above 30, this indicates the beginning of a strong trend! This is the best time to start trading!
Once the Average Directional Index (ADX) moves above 50, this trend is likely to end, and the trading ranges are evolving again.
An example of an Average Directional Index (ADX) medium trend indicator on the chart.
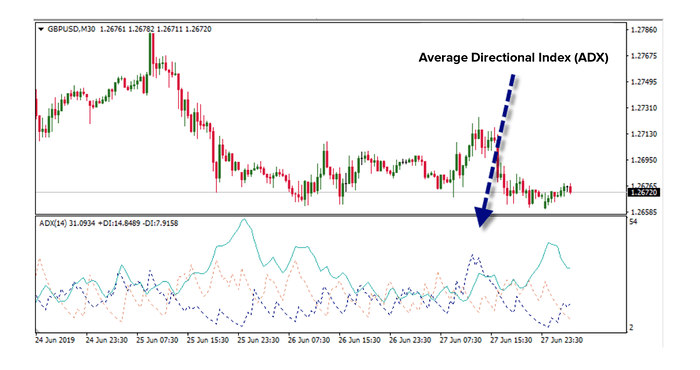
The previous chart shows the ADX medium trend indicator for 14 periods on the MetaTrader 4 platform, in the bottom chart board on the 30-minute chart of the GBP / USD.
The green line is the ADX line while the blue line is the + DI line and the pink line is the -DI line.