Chapter 3 - Introduction to charts
Lesson 3.8 - Support and Resistance in Buying and Selling

We have to emphasize the concept of support, which is a price level below the market movement, and it is an area where buyers activity increases, pushing prices up (such as an uptrend line, support level, down channel line).
The concept of resistance refers to a price level above the market movement, which is an area where sellers activity increases, pushing prices to fall down (such as a down trend line, horizontal resistance level, up channel line).
The main rule in the markets is that the support is buying areas, and the resistance is selling areas.
Accordingly, we will demonstrate a mechanism that enables us to use both trend lines and support and resistance lines together, which is a popular method of trading in financial markets.
This method is based on defining a specific time frame. Then, the trend line, resistance and support lines are determined.
- Buying takes place when prices reach a support level in the presence of an up trend line.
- Selling takes place when prices reach a resistance level in the presence of a down trend line.
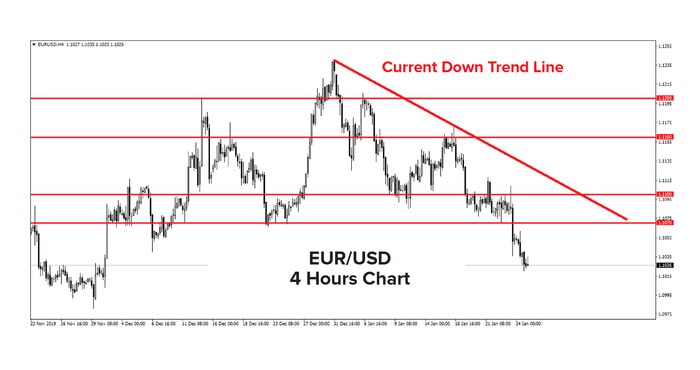
For example, looking closely at the EUR / USD chart, we will do the following:
First, draw the last trend line.
Second, we will draw support and resistance lines on clear peaks and troughs.
- In the following example, we will search for the selling signal. Because the general trend of the four-hour time frames is the chosen time frame, we execute sales operations when prices reach the resistance level that are the best selling points. The stop-loss order is a break of the resistance level up, so selling totally stops if the down trend line is broken.