Chapter 3 - Introduction to charts
Lesson 3.6 - Learn About Trend Lines

Now, we add another tool to our technical tools that give us better opportunities to understand the market trend, which is the trend line tool. The first thing that we must say is that the primary trend line is considered one of the simplest, most widespread, and the most valuable technical analysis tools used by technical analyst. We strongly believe that if you have to learn to use one of the technical analysis tools, it is the trend line.
A trend line is generally a straight line that is drawn by touching the peaks or toughs of the price movement, and it represents the tendency of dealers within the market, and shows the relationship between buyers and sellers.
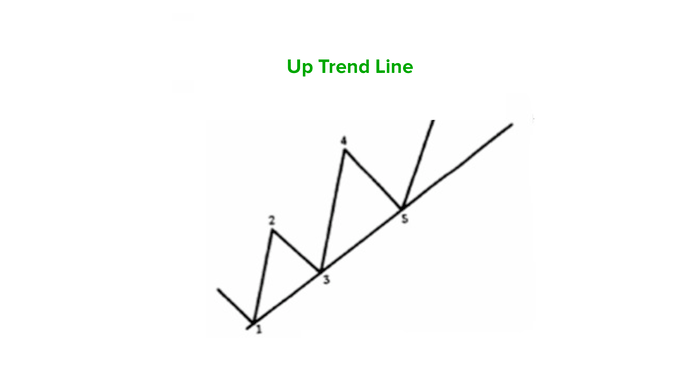
Up trend line: - It is a straight line drawn below the rising toughs, between two points, and is confirmed by a third point. The first two points represent the main focal points on which the trend line is drawn, and the third point represents the point of establishing the price relationship between sellers and buyers.
Carefully looking into the price movement above the uptrend line, you will find that it is moving in the form of very clear peaks and toughs, and that the beginning of the uptrend is also represented in the relationship of the peaks and toughs, we have previously explained. It also reflects the concepts of support and resistance clearly, where each tough represents a support level, and each peak represents a resistance level, and upon breaking the resistance level, it turns into a support level in the subsequent movement.
We must draw attention to the fact that market movement analysis is a process that combines an understanding of the work of all technical tools with each other, and the market is not analysed on the basis of each technical instrument separately or independently.
The up trend line also represents a support level sloping below the market or an increased support level. Thus, when prices touch the trend line, this means that you should be on the buyers side, because their chances of going up are stronger.
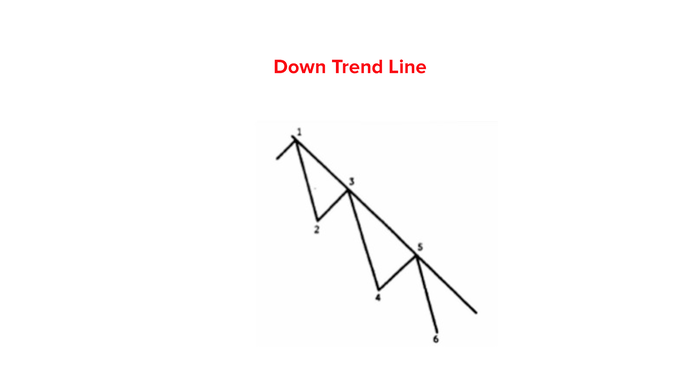
Down trend line: - It is a straight line that is drawn above the descending peaks, between two points, and is confirmed by a third point. In the downtrend also, there must be three focal points for the trend line, the first two points enable us to draw the trend line, and the third point emphasizes the fact that there is a stronger inclination for the selling forces.
The down trend line represents a resistance level sloping above the market movement, and it is also a descending resistance level, and the price touching the down trend line is an ideal opportunity to join the sellers club, because it is the luckiest.
- There is a psychological aspect for the formation of trend lines, but we will not go into it here, rather our focus will be on the aspect of understanding the mechanism of trend lines.
- The topics related to the trend line are multiple and require relatively large time to be fully grasped, not to mention the time required for the analyst to develop his experience with trend lines, know how to use them accurately in order to take the best decision. Therefore, we will choose the trend line topics that match our vision.
- A very important note: - There is a big difference between the trend line, which is a technical tool, and the concept of price trend, which means the general market trend. This means that it is possible for the market to move in a trend, but the nature of the peaks and troughs formed does not allow the drawing of a trend line, and therefore, we use other technical tools to track the markets that are moving in an approach with which it is not possible to draw good trend lines.
Drawing a Trend Line.
When you read "The trend line is drawn between two points, and is confirmed by a third point," The readers may think that it is very simple, but the fact is that it is not that easy. However, with some practice you can quickly overcome obstacles.
The most important obstacles you will face in drawing trend lines are as follows:
1- Choosing the right line between many trend lines.
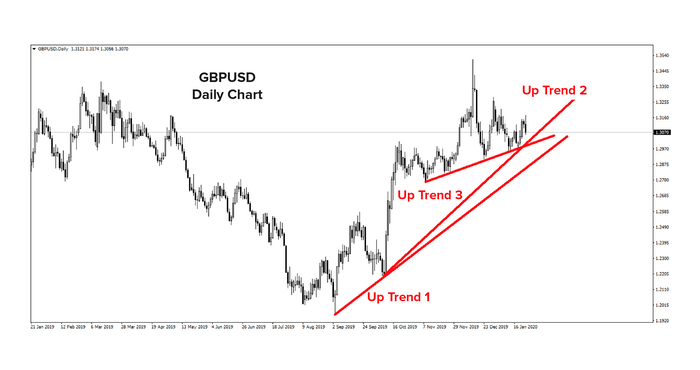
The possibility of drawing a trend line between two points represents a cause of confusion sometimes, as the markets sometimes move at a pace of speed. Then, this pace changes to a degree less or more than the speed, so the possibility of the peaks and troughs appearance changes, which gives the analyst the opportunity to draw more trend lines, and then, the confusion begins,
for example the movement of the British Pound against the US Dollar, on the daily time frame.
2- Opposing Trend Lines
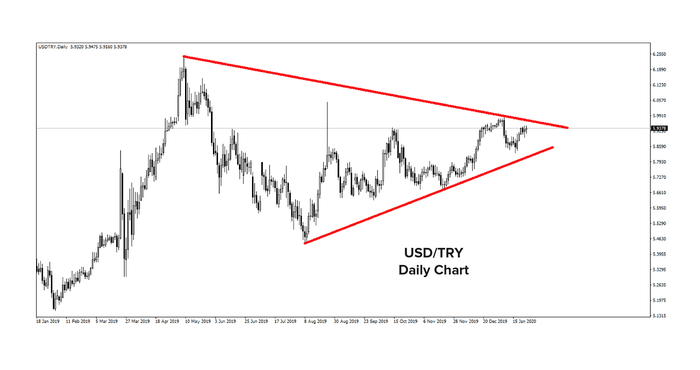
Sometimes, the markets move in such a way that peaks and troughs are formed, enabling the analyst to draw opposite trend lines, meaning that there are two peaks on which a down trend line can be drawn, as well as two troughs on which an up trend line can be drawn, so which of the two lines should be followed by the the analyst,
for example, the movement of the US Dollar against the Turkish Lira on the daily time frame.
3- On which points should the trend line be drawn?
Should the trend line be connected on the basis of connecting the highest price or the lowest price, or on the basis of connecting the closing points?
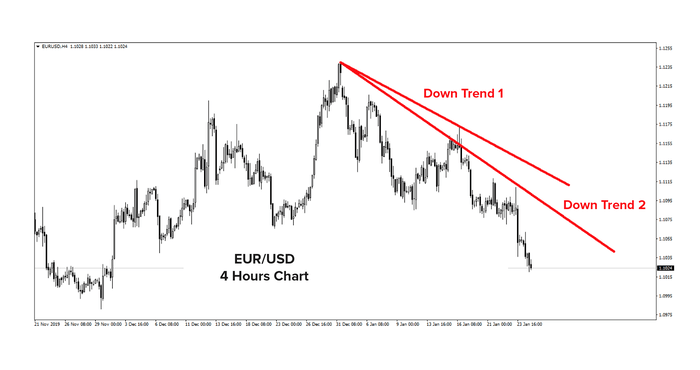
There, we must direct that drawing a trend line on the highest or lowest price basis means that the trend line, along its extension, will include the entire price movement. As for drawing the trend line on the basis of the connecting the closing points, it does not mean that the trend line, along its extension, includes the highest and lowest price movements,
for example, the four-hour downtrend line, for the euro against the US dollar. The first trend line is drawn based on connecting the highest price for each peak, while the second trend line is drawn on the basis connecting the closing points in each peak.
It is worth noting here, that the trend line changes its degree of inclination, as soon as the basis of the peaks and troughs connection changes. The trend line is always drawn on the basis of closing points connection is closer to the price compared to the trend line drawn on the basis of the highest price and the lowest price connection, so the signal for breaking the trend line drawn on the closing points comes faster than the signal for breaking the trend line drawn on the basis of the highest price and the lowest price.
4- The Trend Line Angle of Inclination
Now, we have to talk about a very important thing, which is the trend line angles, in the uptrend, when drawing a horizontal line below the trough from which the upward trend line is drawn, as well as by drawing a vertical line at the same point, we can measure the angle of the trend line incline.
Take, for example, the GBP / USD chart,
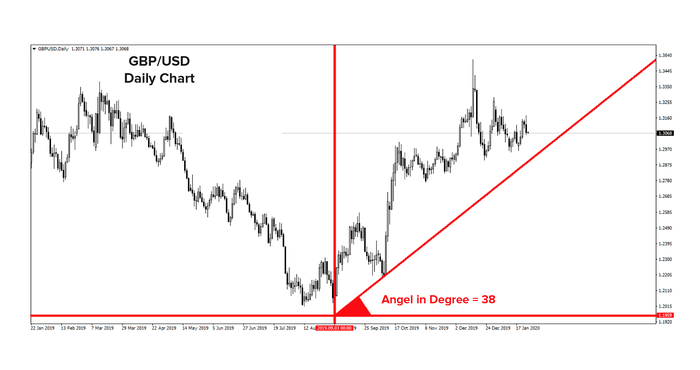
The closer the trend line is to the horizontal line, the trend line slope forms an obtuse angle, and the more the trend line approaches the vertical line, the trend line slope forms an acute angle.
What is the difference between the obtuse angle and the acute angle of the trend line?
The acute angle means that prices rise at a violent and rapid pace, which increases the possibility of breaking this line quickly, because in financial markets, violent and rapid rise does not often last long.
The obtuse angle of the up trend line means that the market trend is weak and that the buyers are not strong enough. The trend line with a sloping angle is usually a difficult line to rely on.
The ideal angle of the trend line is 45 degrees, as it represents a moderate degree of acceleration and can last for a long period.
5- The beginning of the trend line.
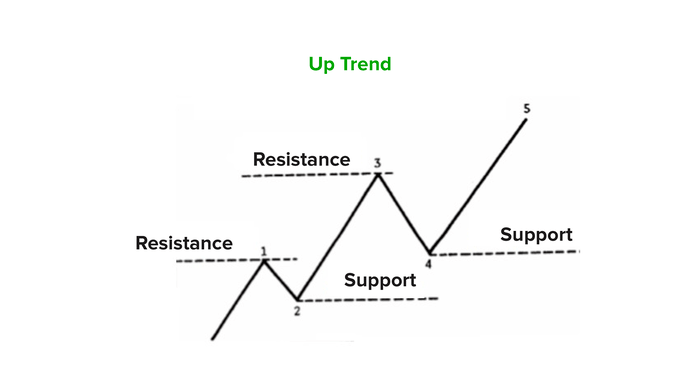
When we talked about the peaks and troughs, we explained the sequence of the peaks and toughs at the beginning of the up and downtrend.
For the record, the following figure represents the sequence of peaks and troughs at the beginning of an uptrend. Therefore, the best up trend line is that drawn between the two lowest troughs in the chosen time period, and they move in this sequence to form the beginning of an uptrend.
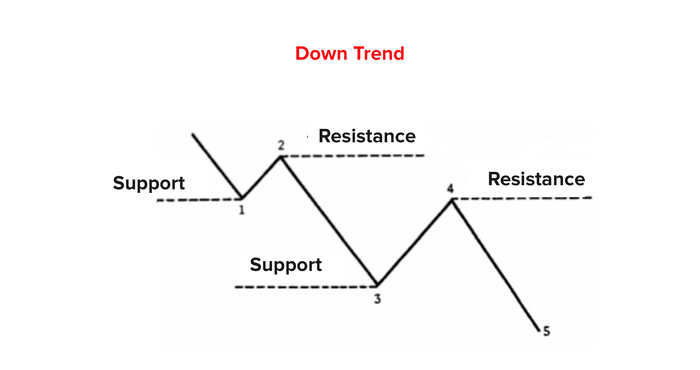
For the record too, the following figure represents the sequence of peaks and troughs at the beginning of a down trend. The best down trend line is that drawn between the two highest peaks that form this sequence.
We have offered a simple explanation of the most important obstacles that may face the technical analyst in his application of the principles of trend line analysis, which bypassing means that the technical analyst uses trend lines in a distinct way that allows him to see the market movement in real terms.
We still emphasize that there are a lot of details that we have not been yet addressed, but we have chosen the most important mechanisms that help you use the trend line.
The most important conditions that characterize the trend line strength
In our explanation of trend lines, we have indicated that the uptrend line represents a downside support level or an ascending support level. We have also explained that the down trend line represents a resistance level sloping above the market movement, and it is also a descending resistance level.
Consequently, trend lines do not depart from being a form of support and resistance, so the conditions for the strength of trend lines are the same as the conditions for the strength of support and resistance lines, which are: -
- The number of times a price touches a support or resistance line.
- The time span of the support or resistance level.
- The distance the price drives before touching the support or resistance line.
- Volumes around the support or resistance level.
- The extent of the rebound after touching the support or resistance levels.
Breaking the trend line
In our explanation of trend lines, we have indicated that the uptrend line represents a downside support level or an ascending support level. We have also explained that the down trend line represents a resistance level sloping above the market movement, and it is also a descending resistance level.
Support and resistance lines do not last forever, and they are broken just as trend lines, so now, we have to explain the breaking of trend lines.
Trend lines are broken and the trend line break is validated with the same rules applied for validating the support and resistance lines break, which are:
1- The price closure is above the down trend line, or below the up trend line..
2- Price stability above or below the trend line.
3- The breakthrough takes place amid high trading activity (large trading volume, or large price candle).
- The fundamental difference between breaking support and resistance lines and breaking trend lines is that breaking the trend line has a goal, while breaking support and resistance lines does not have a clear goal.
The goal of breaking the trend line is a movement opposite to the direction of the trend line from the break point equal to the movement of the last wave,
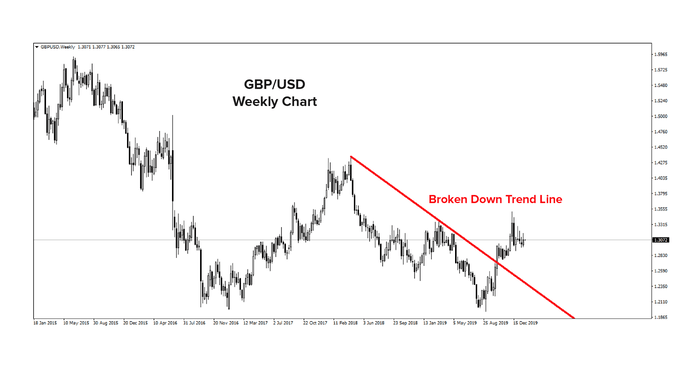
for example, the broken down trend line of the British Pound against the US Dollar on the weekly chart.